
Where chart capacity goes when the sea moves — and how to keep the peak load near the floor.
Worked example: from velocities to allowed payload
The two formulas above chain into one derating calculation. Illustrative deck lift: hoisting at vL = 0.5 m/s, crane-tip vertical velocity vc = 0.6 m/s, supply-vessel deck velocity vd = 0.8 m/s, payload 10 t, effective crane-and-wire stiffness 400 kN/m (illustrative), chart cell 10 t, minimum factor 1.30.
- Relative velocity. vr = ½ vL + √(vc² + vd²) = 0.25 + √(0.36 + 0.64) = 1.25 m/s
- Dynamic factor. √(k/m) = √(400 000 / 10 000) ≈ 6.3 s−1, so ψ = 1 + (1.25 / 9.81) × 6.3 ≈ 1.8
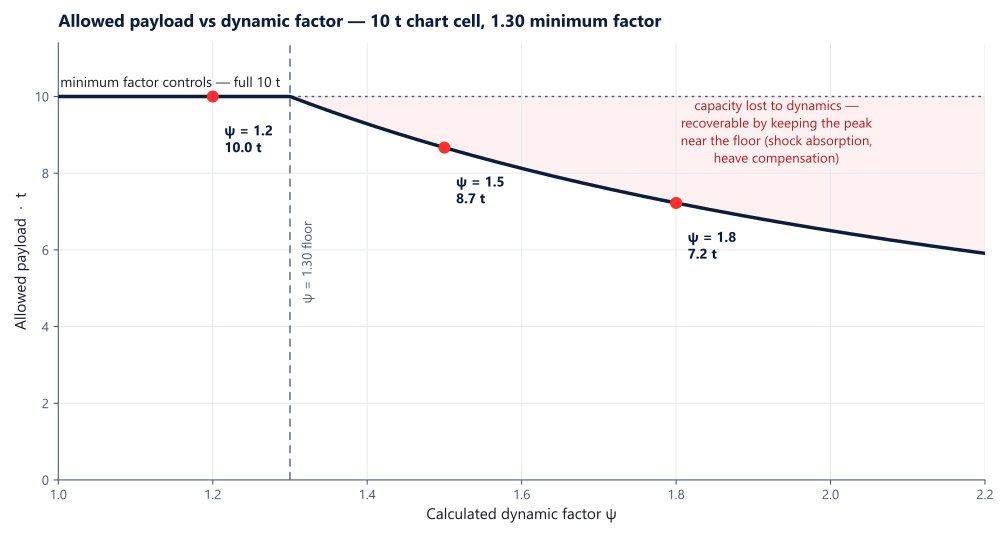
- Allowed payload. ψ = 1.8 exceeds the 1.30 floor, so the chart cell derates: 10 × 1.30 / 1.8 = 7.2 t — a 28% capacity loss from relative motion alone.
Cut the relative velocity — a shock absorber for the single snap at pick-up, heave compensation for repeated wave-cycle motion — and ψ falls back toward the floor, recovering the same chart cell toward its full 10 t. Values are illustrative; the design factor for a real lift comes from analysis.
Illustrative load-chart effect
The example below shows the same crane chart capacity checked with different dynamic factors. It is a simplified calculation example, not a certified POLARIS load chart.
Calculation: allowed payload = chart capacity x 1.30 / dynamic factor. If a POLARIS crane shock absorber keeps the peak load near the minimum factor, the same chart cell can remain much closer to full capacity.
How to reduce load-chart derating
The practical question is not only what the dynamic factor is, but what causes it. Different load cases need different equipment.
- Snap loads and deck pick-up: use a POLARIS crane shock absorber. The absorber adds controlled stroke and damping between crane and payload, so a single velocity mismatch — deck pick-up, snap, overload — is absorbed before it becomes peak hook load. It needs time to reset between events; where slack–snap cycles repeat through the wave zone, heave compensation is the right tool.
- Splash-zone crossings and subsea lifts: use passive heave compensation to reduce hook-to-payload relative motion. RIGEL and CYGNUS cover simpler passive cases; ANTARES is used for complicated or multi-step subsea lifts with changing buoyancy.
- Topside active heave compensation: use active heave compensation where residual motion must be minimized. In practice it is reserved for the narrow band of cases where the performance justifies the cost and complexity; for most load-chart cases an adaptive-passive compensator such as ANTARES closes much of the gap without external power.
- Operational controls: use controlled hoisting speed, plan soft lift-off, avoid re-contact, avoid resonant sea states and use suitable weather windows. Equipment reduces the peak load, but the lift procedure still sets the starting conditions.
For a first-pass product check, use the heave compensator selection guide. For a full review, send the crane radius, SWL, lift speed, payload, sea state, wave period and lift sequence.
Standards and classification
Crane load charts for offshore operations are governed by DNV-ST-0378, DNV-RP-N202, API 2C and EN 13852. Norwegian Dynamics products are designed and classed according to DNV-ST-0378 where applicable.