
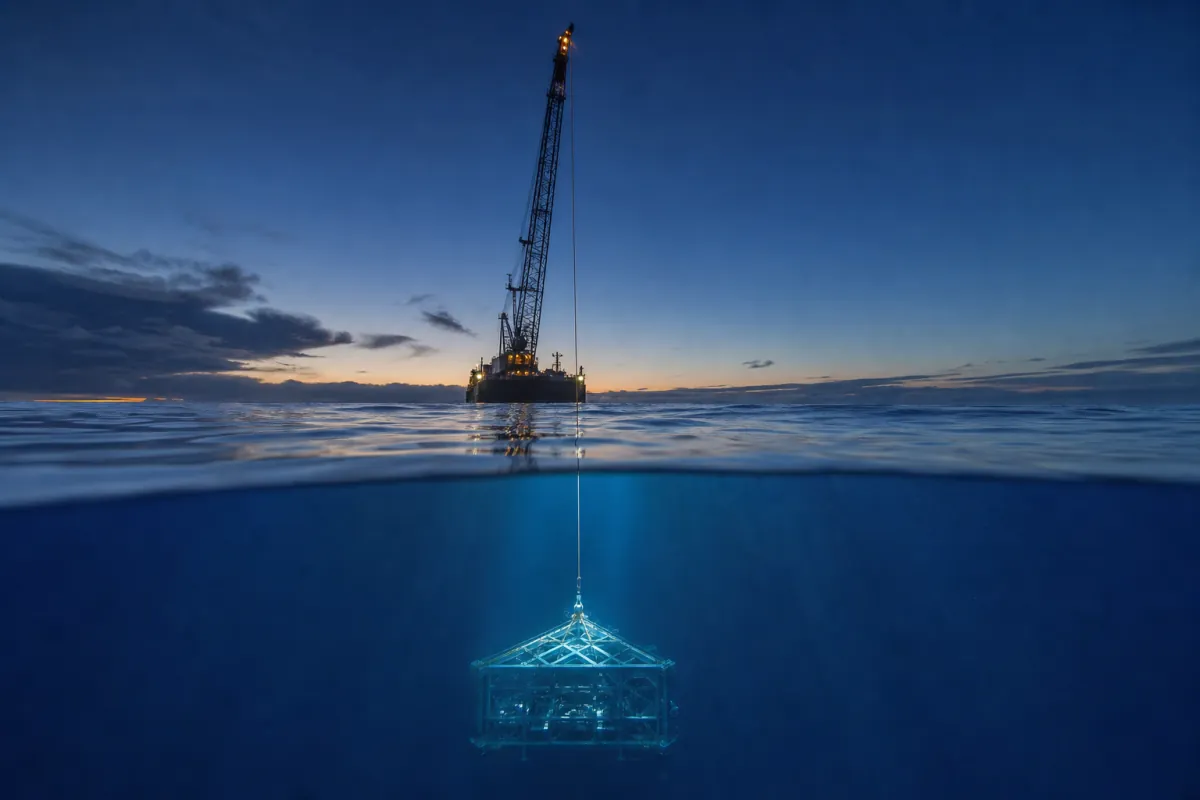
Underwater, the water lifts with you — and against you: buoyancy, slam, drag, added mass.
Subsea Lifts
By Peter Wang, COO · December 2025
Practical application: For practical application of this topic, see RIGEL Basic PHC and engineering studies and analysis.
Subsea lifts are among the most complex offshore operations, requiring careful planning to account for hydrodynamic forces that act on the payload as it moves through water. The two most significant effects are drag and added mass, both of which increase the effective weight and dynamic loads on the crane and lifting equipment.
Understanding these forces is critical for selecting the right subsea heave compensator and ensuring the crane has sufficient capacity for the operation.
How does drag affect a subsea lift?
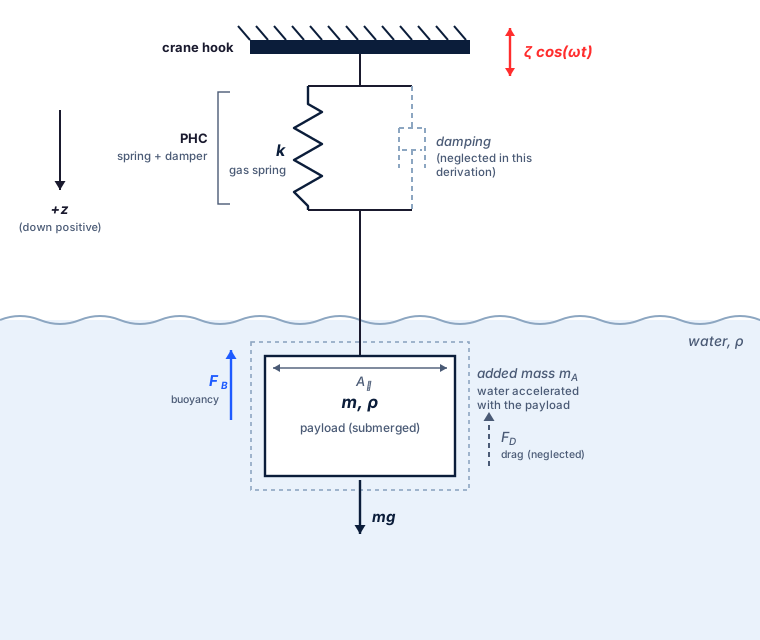
Drag in a subsea lift is similar to drag on a car due to air resistance and varies with the square of the speed. How big the drag force will be depends on the area perpendicular to the motion as well as the drag coefficient (which we again know from cars competing to always have lower drag coefficients to increase range). The main difference from a car however is that the fluid is water and not air which have 1000 times bigger mass density, which is another factor in the drag force.
F_D = \tfrac{1}{2}\rho_w C_D A_\perp \dot z |\dot z|
Where C_D is the drag coefficient (more info can be found in DNV RP-N103, some examples shown below) and \dot z is the payload vertical velocity.
| Shape | C_D | A_{\perp} | Notes |
|---|---|---|---|
| Sphere | C_D = 0.5 | A_{\perp} = \pi r^2 | |
| Horiontal Cylinder | C_D = 1.2 | A_{\perp} = 2 r L | |
| Vertical Cylinder | \frac{L}{2r}=0.5 \Rightarrow C_D=1.1 \frac{L}{2r}=1 \Rightarrow C_D=0.9 \frac{L}{2r}=2 \Rightarrow C_D=0.9 \frac{L}{2r}=4 \Rightarrow C_D=0.9 \frac{L}{2r}=8 \Rightarrow C_D=1.0 | A_{\perp} = \pi r^2 | |
| Cube | C_D = 1.05 | A_{\perp} = a^2 | Face normal to flow. |
| Cone | C_D = 0.50 | A_{\perp} = \pi r^2 | Pointed tip aligned with flow; dependent on cone angle. |
| Rectangular Plate | C_D = 1.1+0.02 (\frac{L}{W}+\frac{W}{L}) | A_{\perp} = L W | Normal to flow. |
Let’s do a practical example to get a feeling about the relevance. Assume you are lifting a payload that is shaped like a rectangular plate with length 15 m and width 10 m. The wave period is 8 seconds and the wave height is 4 m, assume sinusoidal waves. How big will the force be?
First lets find the peak speed; the wave motion is given as
z = \zeta \cos(\omega t)Since \omega = \frac{2 \pi}{T_p} we then have a peak speed of 1.57 m/s.
We can then calculate the drag coefficient as:
C_D = 1.1 + 0.02 \left( \frac{15}{10} + \frac{10}{15} \right) = 1.14
Our drag area is:
A_\perp = 10 \cdot 15 = 150 \,\mathrm{m^2}
How does added mass affect a subsea lift?
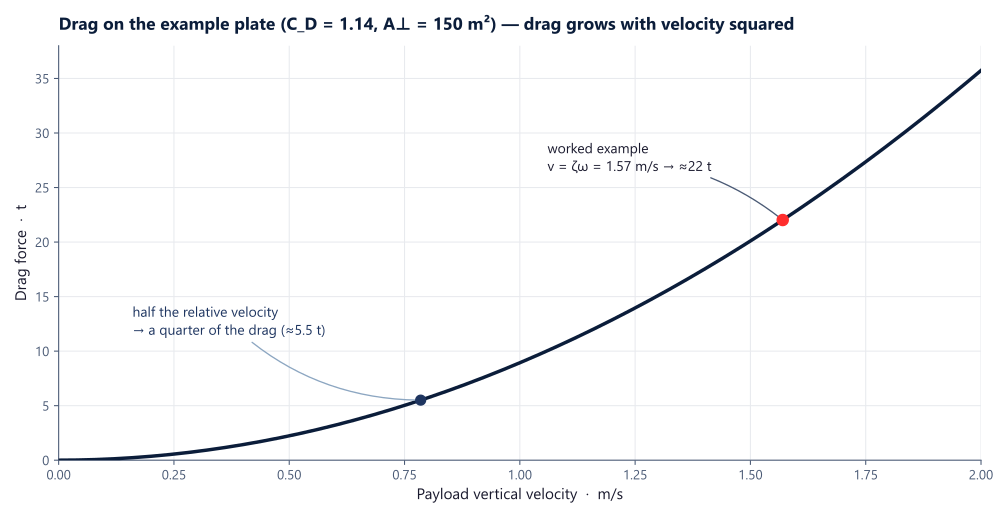
Added mass in a subsea lift is very important as it can cause big additional inertia, which in turn can cause big dynamic forces. It comes from the fact that when a payload oscillates in water due to heave motion it also has to accelerate surrounding water and mathematically it is given as:
m_A = \rho_w C_A V_R
Where C_A is the added mass coefficient (can be found in DNV RP-N103, some examples below) and V_R is the reference volume.
| Shape | C_A | V_R | Notes |
|---|---|---|---|
| Sphere | C_A = 0.5 | V_R = \frac{4}{3}\pi r^3 | Constant in all directions. |
| Cylinder | \frac{L}{2r}=1.25 \Rightarrow C_A=0.62 \frac{L}{2r}=2.5 \Rightarrow C_A=0.78 \frac{L}{2r}=5 \Rightarrow C_A=0.90 \frac{L}{2r}=9 \Rightarrow C_A=0.96 \frac{L}{2r}=\infty \Rightarrow C_A=1.00 | V_R = \pi r^2 L |
Vertical motion along cylinder axis in infinite fluid. |
| Rectangular Plate |
\frac{L}{W}=1 \Rightarrow C_A=0.58 \frac{L}{W}=2 \Rightarrow C_A=0.76 \frac{L}{W}=4 \Rightarrow C_A=0.87 \frac{L}{W}=8 \Rightarrow C_A=0.93 \frac{L}{W}=\infty \Rightarrow C_A=1.00 | V_R = \frac{\pi}{4}W^2 L | Motion normal to surface. |
| Circular Disc | C_A = \frac{2}{\pi} | V_R = \frac{4\pi}{3} r^3 | Motion normal to surface. |
| Square Prism |
\frac{L}{W}=1 \Rightarrow C_A=0.68 \frac{L}{W}=2 \Rightarrow C_A=0.36 \frac{L}{W}=4 \Rightarrow C_A=0.19 \frac{L}{W}=10 \Rightarrow C_A=0.08 | V_R = W^2 L | Prismatic body with square base. |
Let’s do another practical example. Assume you are lifting a payload that is shaped like a rectangular plate with length 20 m and width 10 m. The wave period is 8 seconds and the wave height is 4 m, assume sinusoidal waves. How big will the force due to added mass be?
We need to find the maximum acceleration (derivative of speed as shown in drag example), which is given by:
Thus the maximum acceleration is:
Next the added mass coefficient is 0.36 and our reference volume is 2000 cubic meters. We can then calculate the force using:
F=m a=1025 \cdot 0.36 \cdot 2000 \cdot 1.23=98 \mathrm{t}Note that for subsea lifts close to seabed, the added mass may increase due to confinement.
Deck to seabed, one run
One continuous lowering: the compensator is locked on deck, unlocks just above the surface, then switches gas mode as the load submerges — stiff through the splash, soft for a compliant set-down.
ANTARES adaptive passive heave compensation, deck to seabed — simulated in CONSTELLATION. For the full Hs×Tp operating-window screen of a lift like this, see operability screening.
The four forces, one table
Drag and added mass are the two calculated above — buoyancy and slamming complete the picture, and each phase of the lift has a different boss:
| Force | Scales with | When it dominates | What it does to the lift |
|---|---|---|---|
| Buoyancy | Displaced volume (ρwVg) | From water entry; varies fast while crossing the surface | Effective weight drops and fluctuates — slack-wire risk |
| Slamming | Impact velocity at water entry | Splash zone | Short, sharp load spikes on payload and rigging |
| Drag | Velocity squared (½ρwCDA⊥v²) | Submerged descent through waves and current | ≈ 22 t on the example plate at peak heave velocity |
| Added mass | Acceleration (ρwCAVR × a) | Any oscillation; grows near the seabed (confinement) | ≈ 98 t of extra inertial force in the example above |
The splash zone stacks slam, fast-changing buoyancy and wave-particle velocity in a few metres of travel — see splash-zone crossing and the method reference DNV-RP-N103.
Forces of this scale — a ≈98 t inertial force on top of the static weight — are why heavy subsea lifts run on a passive compensator sized for the case. It cuts the relative velocity and acceleration (collapsing the v² drag and the added-mass force) and keeps the wire tensioned so slack–snap cannot develop. For the heavy and deepwater band that compensator is CYGNUS (12.5–10 000 t); RIGEL and ANTARES cover the standard and adaptive cases.
Landing speed: the last half-metre
Impact at touchdown scales with velocity — and without compensation that velocity is set by vessel heave, which nobody controls. A hard or bouncing landing risks:
A compensated landing removes the heave component (the load descends at the winch rate, not winch plus heave) and raises damping for the final approach, turning touchdown into a controlled deceleration — typically 0.1–0.5 m/s, set by the operator and largely independent of sea state:
Adjustable damping is the key feature for landing work: ANTARES adds an adaptive gas spring and rod locking to hold the load secure after set-down; where an exact lowering velocity must be dialled in, an active system provides that control. The motion-ratio physics behind soft landings is derived in passive heave compensation basics.
What depth does to the compensator
The four forces above act on the payload. Three more effects act on the compensator itself as it descends — each one shifting the unit off its working point — and a fourth is kept out by engineering discipline:
| Effect | What it does to the compensator | The answer |
|---|---|---|
| Buoyancy | Net payload weight drops in water → the equilibrium position walks inward, in the worst case to full retraction | Adaptive: gas pressure down, equilibrium recentred — and a longer natural period as a bonus |
| Temperature | ≈ 1% of gas pressure per 3 °C of cooling — roughly 5% of stroke — lost fast through the thermocline | Adaptive: onboard high-pressure gas tops it back up |
| Water pressure | ≈ 1 bar per 10 m of depth acts on the rod area and pushes the rod in — a 250 t lift with a 180 mm rod at 1,000 m sees ≈ 26 t, shifting equilibrium from mid-stroke to ≈⅙ of stroke | Adaptive: pressure adjusted down with depth |
| Leakage | Water ingress — historically anything from lost performance to corrosion to explosions | Design + testing + maintenance: double seals, external-pressure testing at FAT, compartmentalisation, scheduled seal replacement |
The first three are equilibrium problems an adaptive unit corrects on the fly; the fourth is engineering discipline.
How much does temperature matter?
What does depth pressure do to the compensator?
How is water leakage into the compensator prevented?
Why choose an adaptive compensator for deep work?
Subsea lifting — frequently asked
Why is a subsea lift harder than a lift in air?
How large can drag get?
What is added mass, in practice?
Which force dominates the splash zone?
How does heave compensation protect the lift?
Working on a lift that needs this?
We size compensators against drag, added mass and snap-load — send the subsea lift case for a recommended product and dimensions (for heavy lifts, typically the CYGNUS passive heave compensator).